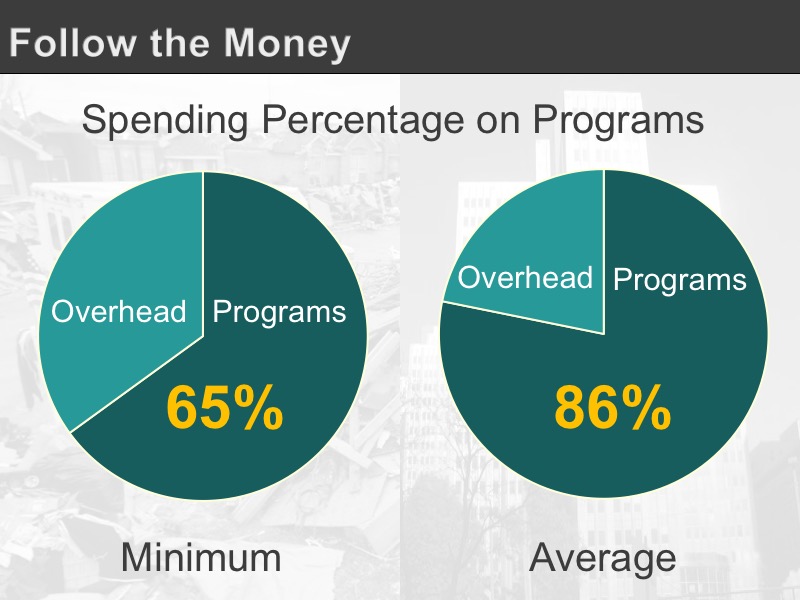
Unions like to present themselves as similar to a nonprofit organization, working for the benefit of those they supposedly represent. One of the best ways to evaluate the trustworthiness of a nonprofit is to look at the percentage of total spending that goes directly into their stated programs, versus what they spend on running the organization.
Charity watchdogs like the Better Business Bureau Wise Giving Alliance and the Charity Review Council say this percentage should be no lower than 65%.
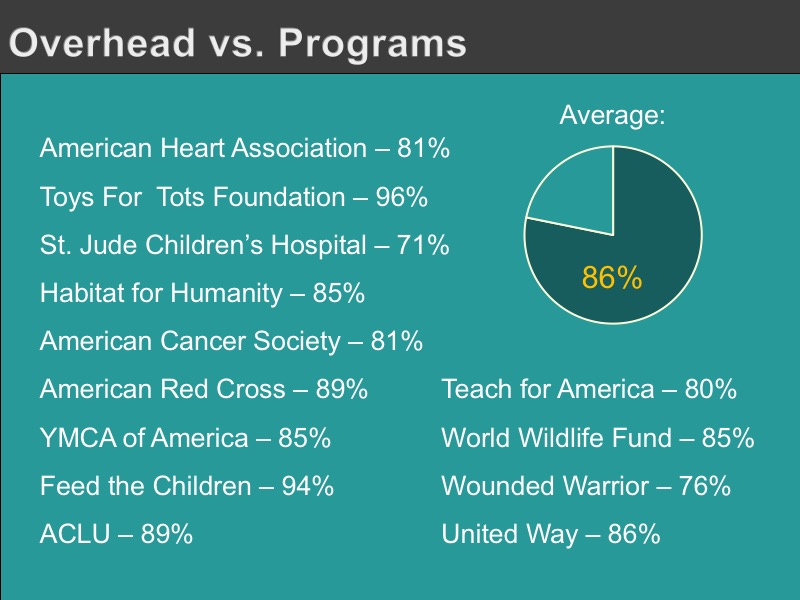
The average spending on programs of the top 100 charities in the country, according to the Forbes Top Charities list for 2017, was 86% – far above the minimum.
The image above is a list of how some well-known nonprofits stack up to this measure.
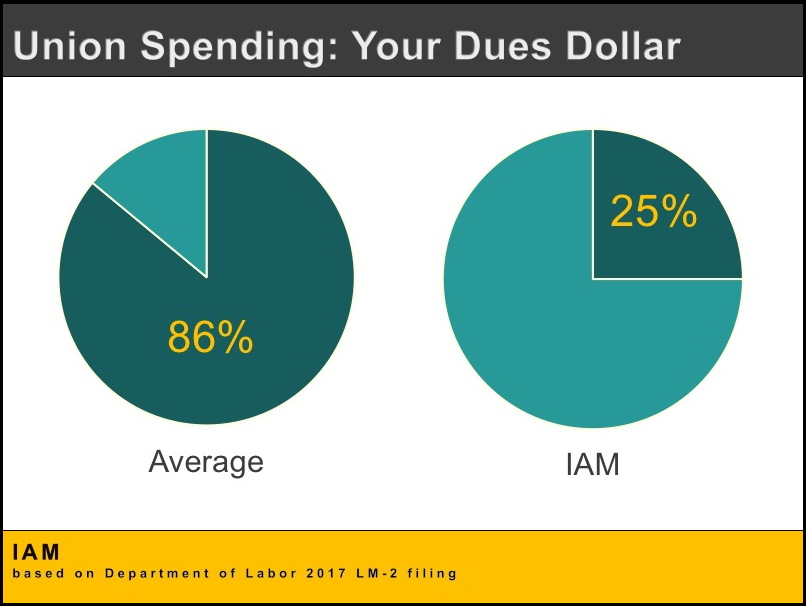
Did the IAM even come close?
Hardly! According to their own financial statement, the IAM posted total income of almost $181 Million in 2017, yet spent only 25% on Representational Activities, including strike payments. The rest was spent on salaries, benefits and perks, office space and equipment, politics, taxes, and other overhead expenses. Almost the exact opposite of organizations whose stated purpose is to help people.
23% Decrease in membership
- 2017: 564,953 77%
- 2000: 730,673 100%
36% Increase in dues collected
- 2017: $134,314,845 100%
- 2000: $99,091,546 64%
From 2000 to 2017, the IAM lost 165,720 members, or just about 23% of their total membership. Yet in 2017, the IAM collected 36% more income while with fewer members. Dues, along with fines, fees and assessments, are the major source of a union’s income. How safe is your wallet?
An old adage reminds us to “choose our friends wisely.”
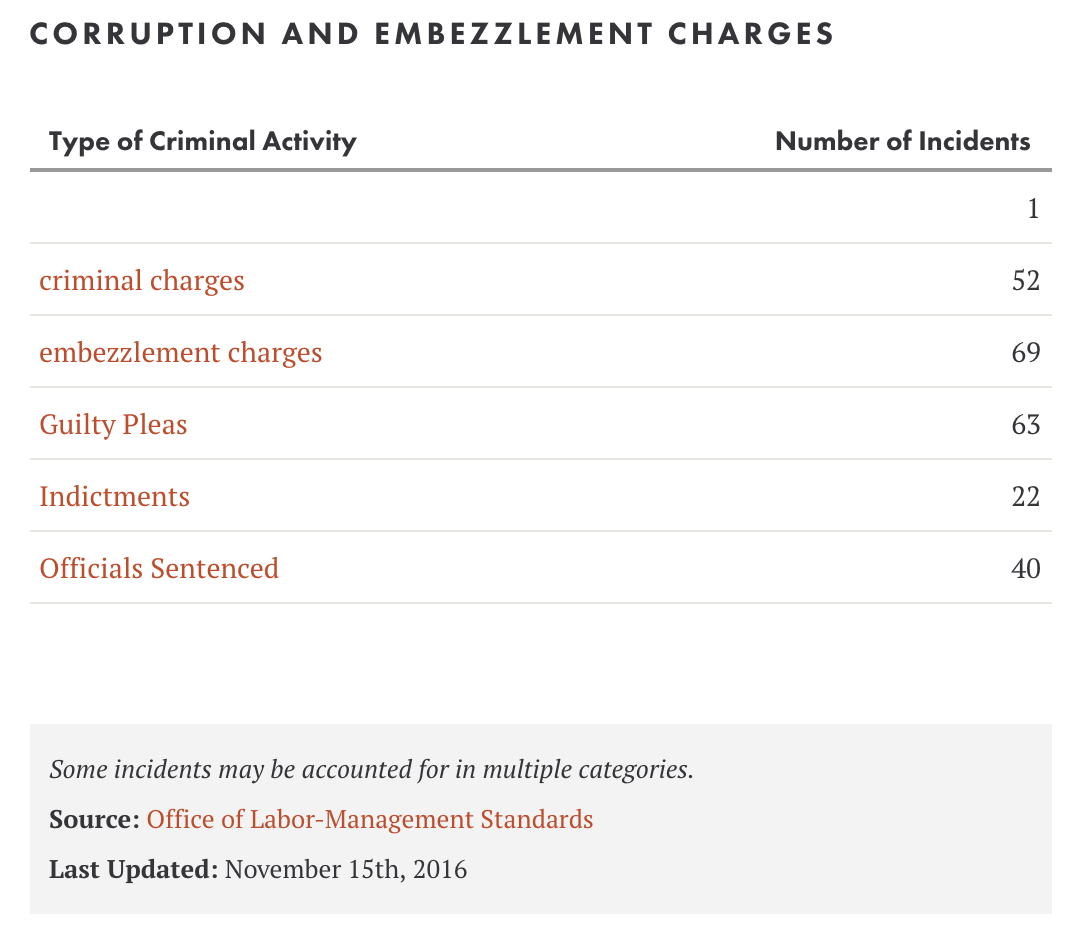
The table at the right provides some indication of the “company you keep” with the IAM. Another indication is how many Unfair Labor Practice charges have been filed against them. Although the IAM has gotten better since the mid-90’s when they averaged about 240 ULP’s per year, in the last 10 years they’ve still averaged 117 ULP’s each year.
They have also averaged about 10 strikes per year over the last five years. Over the last 10 years, the average strike lasted over 4 and a half months. That’s quite a while to be without a paycheck. During that same 10 years, 20 strikes lasted over 100 days, and 5 strikes lasted over 900 days.